Alikhani M a,b, Chou MY b, Alikhani M a, Sangsuwon C a, Abdullah F a, Teixeira CC a
Objectives: To investigate the activity of inflammatory markers and their effect on the rate of orthodontic tooth movement in response to different force magnitudes in adolescents and adults.
Methods and Materials: We recruited healthy human subjects of both sexes and in different age groups (age 11-14 and 21-45) requiring maxillary first premolar extractions and canine retraction. Each subject in both age groups was randomly assigned to receive one of the following four magnitudes of force during canine retraction: 50, 100, 150, and 200 cN. Gingival crevicular fluid (GCF) from the distolabial crevice was collected one day after the start of canine retraction. The protein levels of different inflammatory markers in GCF, including IL-1β, CCL2, and RANKL, was measured using antibody-based assays. The rate of canine retraction was measured on study models after 28 days of force application. Differences within and between groups were assessed statistically.
Results: Thirty-two subjects were recruited, with 4 subjects in each force magnitude subgroup for a total 16 subjects per age group. There was a linear relation between the force and the cytokine levels in response to lower magnitudes of force. However, higher magnitudes of force did not increase the cytokine levels in either age group, i.e. the cytokine levels reached a saturation point. Adolescents had lower cytokine levels at lower magnitudes of force than adults, but the levels increased at higher force magnitudes while adults reached saturation of the response earlier. The rate of canine movement in 28 days was not significantly different between adolescents and adults, and higher magnitude of force did not increase the rate of movement. However, tooth movement rate was higher in adolescents for all force groups.
Conclusion: Saturation of biological response to orthodontic force exists in humans. After reaching a certain magnitude of force, the biological response saturates, and higher magnitude of force does not increase inflammatory markers nor the amount of tooth movement. Adolescents have higher saturation point than adults.
Keywords: Adolescent, Adult, Rate of tooth movement, Inflammatory markers, Saturation point, Cytokines
In our previous animal study, we demonstrated that an increase in orthodontic force magnitude is accompanied by higher levels of cytokine and chemokine expression only up to a certain point [1]. Increasing the magnitude of force beyond that point did not produce higher levels of inflammatory markers or osteoclast activation, nor did it increase the rate of tooth movement. This observation led to the conclusion that there is a “biological saturation point” in orthodontics beyond which a higher magnitude of force will not increase the biological response. According to this theory, at a lower range of force magnitude, there is a linear relationship between the magnitude of force and the level of inflammation, but after reaching a certain magnitude of force, the cell-free zone (the necrotic zone) in the PDL is maximized, and further inflammation is not possible until the necrotic tissues are cleared by the remodeling mechanism.
While we established a saturation point in animals, it was not clear if it also exists in humans. Understanding if there is a saturation point in humans is clinically essential as its absence would justify applying as strong a force as possible to move teeth as quickly as possible. On the other hand, if there is a saturation point, then the application of higher forces would not provide any clinical advantage and only expose patients to an increased risk of side effects, such as root resorption [2-6]. Current literature relating force magnitude to the rate of tooth movement has produced contradictory results [7-9]. Therefore, this field warrants further research. Assuming that a saturation phenomenon exists in humans, the next question would be whether saturation points are identical or different between different individuals. This has a significant impact on clinical decisions regarding force optimization. If the saturation point is the same among individuals, one could predict the saturation point and the optimal force for tooth movement for other individuals. On the contrary, if the saturation point is different among individuals, then different amounts of force magnitude should be considered in different individuals to optimize the rate of tooth movement.
We focused on age to study individual variability in the biological saturation response during orthodontic tooth movement. The selection of age as the main variable was based on a previous clinical study in which we demonstrated differences in biological response and rate of tooth movement to an identical orthodontic force between individuals of different ages [10]. Previously we showed that when applying an identical magnitude of force, adults have a higher level of inflammatory response than adolescents, but a slower rate of tooth movement during the first two months. Based on these results, there is a possibility of variation in the saturation point among different ages that requires further investigation.
Human subjects
The institutional review board of New York University approved a non-randomized, single-center, single-blinded clinical study. We recruited healthy human subjects of both sexes and in different age ranges (age 11-14 and 21-45), regardless of their race or ethnicity. Patients were recruited based on 1) meeting the inclusion and exclusion criteria summarized in Table 1, and 2) needing maxillary canine retraction of at least 3 mm. Subjects included in the study had fully erupted maxillary canines with a Class II Division 1 malocclusion that required the removal of both maxillary first premolars. The overall study design is summarized in Figure 1.
Investigators
Two orthodontic residents were trained and calibrated by the principal investigator (M.A.) They were responsible for screening and examining the subjects, determining their eligibility, and rendering the orthodontic treatment under the supervision of a faculty member who was not the principal investigator. Before starting orthodontic treatment, patients who met the selection criteria completed an informed consent form either by themselves as adults or as guardians of minors, before starting orthodontic treatment. The subjects and the residents rendering the treatment were aware of the subjects’ age and, therefore, not blinded. The investigators performing the measurements of samples and data analysis were blinded to the subjects’ identities and ages.
Figure 1. Diagram of the study design and group assignment. Subjects were healthy adolescents aged 11 to 14 and adults aged 21 to 25. One of four force magnitudes (50, 100, 150, or 200 cN) was randomly assigned to each subject in both age groups to retract the canine. Canine retraction was started at least six months after the first premolar extraction.
Table I. Inclusion and exclusion criteria of the clinical study
Treatment
Initial orthodontic records were obtained for all subjects prior to orthodontic treatment, including extra/intraoral photos, panoramic radiograph, lateral cephalogram, periodontal measurements, and alginate impressions. At the beginning of orthodontic treatment, fixed appliances were bonded on both arches (0.022” McLaughlin, Bennett, and Trevisi [MBT] prescription), including maxillary canine brackets with an auxiliary vertical slot (GAC International, Bohemia, NY, USA). Teeth were leveled and aligned with a sequence of arch wires from 0.016” NiTi, 0.016” × 0.022” NiTi, to a final 0.018” × 0.025” stainless steel for this study. All subjects were monitored for oral hygiene and periodontal status at each office visit throughout the orthodontic treatment. Routine orthodontic treatment continued after the period of study.
To minimize operator variability, patients were referred to the same surgeon for the extraction of the maxillary first premolars. Canine retraction was not initiated until leveling and aligning were achieved, at least six months after the first premolars were extracted. Periapical radiographs were taken to evaluate the morphology and integrity of canines and molars and estimate their center of resistance based on their root length.
Canine retraction was initiated by applying a calibrated nickel-titanium closing coil spring (GAC International®) that generates a constant force at a designated magnitude of force. Each subject in both age groups was randomly assigned to receive one of the following four magnitudes of force: 50, 100, 150 and 200 cN. The coil spring was connected from a power arm extending from the accessory tube of the molar bands to a power arm extending from the ipsilateral canine bracket (Figure 2). The length of the power arms was determined by the estimated location of the center of resistance using the periapical radiographs. The extended power arms allowed force application to be as close to the centers of resistance as possible, therefore facilitating bodily movement of the canines. To minimize the movement of adjacent teeth while the canine was retracted, the anterior teeth (lateral incisor-to-lateral incisor) were co-ligated as a segment with ligature wire, as well as the posterior teeth from the 2nd premolar to the 2nd molar. The canine chosen for evaluation in each subject was randomly selected from either left or right side to minimize the effect of uneven occlusal force due to habitual occlusion predominantly on one side.
Patients were asked to refrain from taking any pain medication, and were seen 24 hours after initiating the canine retraction for the first follow-up visit. At each following visit after canine retraction was initiated, the force generated by the coil was checked, and the appliances were monitored for any deformation or change in position due to chewing.
The timetable of events and data collected at different time points are summarized in Table 2. This clinical study was concluded after 4 weeks of canine retraction, and the subjects continued to receive orthodontic treatment at the Department of Orthodontics at New York University College of Dentistry. Routine orthodontic final records were taken at the end of treatment.
Figure 2. Canine retraction apparatus. Canine retraction was initiated by connecting a calibrated nickel-titanium closing coil springs (GAC International®) which generates a constant force at a selected magnitude from a power arm extending from the accessory tube of the molar bands, to a power arm extending from the ipsilateral canine bracket. The force application was estimated to pass the centers of resistance of both canine and molar.
Table 2. Timetable of events during the duration of the clinical study
Gingival Crevicular Fluid (GCF) Sampling and Protein Analysis
To evaluate the level of inflammatory response, gingival crevicular fluid (GCF) samples were collected from the distobuccal gingival crevice of the maxillary canines of each subject one day after retraction was initiated. Collection of samples was performed between 10 AM and noon to minimize the influence from diurnal variation. If present, supra-gingival plaque was removed, and cotton rolls were used to isolate the region before GCF samples were collected with filter-paper strips (Periopaper, Oraflow Inc, Smithtown, NY, USA). One strip was carefully inserted 1 mm below the gingival margin into the distobuccal gingival crevice of the canine for 10 seconds. To avoid the contamination of GCF samples with blood, gingival index and probing depths were not assessed until GCF samples were collected.
Sample volume was assessed with Periotron 8000 (Oraflow) according to the manufacturer’s instructions. Total protein level was quantified using the BCA protein assay kit (Pierce, Rockford, IL, USA). An estimated volume of 0.6 to 1.2 μL of GCF was collected and diluted with phosphate-buffered saline (Invitrogen, Burlington, ON, Canada) to obtain 50 to 100 μL of sample required for analysis. Cytokine levels were measured using a custom glass slide-based protein array for the following cytokines: IL-1β, CCL2 (MCP1), and RANKL (RayBiotech, Norcross, GA) according to the manufacturer’s instructions.
Study Model Analysis for Rate of Tooth Movement
To evaluate the rate of canine retraction, alginate impressions were taken at the following time points: before orthodontic appliances were bonded, immediately before initiation of canine retraction, and 28 days after canine retraction. The impressions were poured up with plaster (calcium sulfate) immediately. The models were labeled with the date taken and the patient’s assigned ID number for the study. On the palatal surface of the lateral incisors and canines, vertical lines were drawn from the middle of the incisal edge to the middle of the cervical line, dividing each crown into equal halves (Figure 3A). Three landmarks along these lines were marked at the incisal edge, in the middle of the crown, and at the CEJ or gingival line (Figure 3B). Distances between these landmarks on the canine and its adjacent lateral incisor were measured, added together and averaged on each model. The amount of canine retraction was calculated by subtracting the averaged distances before and 28 days after canine retraction.
The distance between landmarks on the study models were measured using a digital caliper (Orthopli Corp, Philadelphia, PA, USA) with an accuracy of 0.01 mm. Both intra-observer and inter-observer errors were evaluated. For the evaluation of the intra-observer error, 10 models were measured twice at least 2 weeks apart. For the inter-observer error, a second investigator (M.A.) measured the same set of models twice, and the mean values of these two measurements by each investigator were compared. The random and systematic errors were calculated using a formula described by Dahlberg [11] and Houston [12]. Both the random and systematic errors were found to be small and insignificant. Random errors were 0.031 mm for the intra-observer evaluation and 0.039 mm for the inter-observer evaluation. Systematic errors were 0.028 mm for the intra-observer evaluation and 0.036 mm for the inter-observer evaluation (p < 0.001).
Figure 3. Landmarks used for analyzing rate of tooth movement on study models. Study models were obtained prior to orthodontic treatment, and immediately before and 28 days after initiation of canine retraction. The amount of tooth movement was measured after canine retraction. (A) Lines that divided lateral incisors and canines into equal halves were drawn over the palatal surface of the models (red solid lines). (B) Three points (red dots) along the line were marked at the incisal edge, in the middle of the crown, and at the CEJ or gingival line. A single distance moved measurement for each tooth was determined by averaging the distance moved at the three points.
Sample size measurement
To calculate the sample size, we performed a power analysis using the following formula, assuming the probability of committing a type I error is 5%, and setting the power of the statistical test at 90% (power = 0.9, β = 0.1).
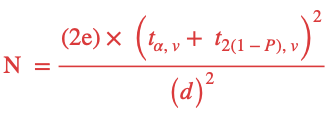
Where N = the sample size, e = the population standard deviation, d = the difference in means that is expected to be detected. We used the results from our previous clinical study [13] as a guide to estimate that there will be a 50% difference in cytokine expression between the two age groups, α = significance level, v = the degrees of freedom, ![]() = the t value corresponding to α and v, and P = the desired statistical power.
= the t value corresponding to α and v, and P = the desired statistical power.
Based on this calculation, a sample size of 32 was determined for this study, with n=4 per force magnitude group, and n=16 per age group.
Statistical Analysis
Comparisons between groups were assessed by analysis of variance (ANOVA). Pairwise multiple comparison analysis was performed with the Tukey’s post hoc test. In some experiments, paired and unpaired t tests were used to compare the 2 groups. Two-tailed p values were calculated, and p < 0.05 was set as the level of statistical significance.
Subject Recruitment
Thirty-two subjects were recruited and completed the study with no loss to follow-up. Four subjects were included in each force magnitude subgroup for a total of 16 subjects enrolled per age group. The adolescent group (aged 11-14) was comprised of 11 females and 5 males, and the adult group (aged 21-45) was comprised of 9 females and 7 males. The subjects were recruited from patients who came to the Department of Orthodontics at New York University for comprehensive orthodontic treatment. The age range of adolescent group was 12 to 14 years, with mean age of 12.8 years. The age range of adult group was 26 to 42 years, with mean age of 35.4 years. The patients had similar type and severities of malocclusion (Table 3). All patients maintained good oral hygiene throughout the study and took no additional medications, including analgesics.
Table 3: Comparison of the morphologic characteristics of the patients in the adolescent and adult groups. No statistically significant differences were observed for the cephalometric measurements listed in Table 3.
Level of Inflammatory Markers
All subjects received similar orthodontic treatment in the leveling and aligning stage. Each subject was randomly assigned to receive a specific magnitude of force for canine retraction, ranging from 50 to 200 cN. GCF samples were collected from the distobuccal gingival crevice of the canines one day after activation of the retraction apparatus (Table 2). The levels of selected inflammatory markers were measured by protein arrays (Figure 4).
In the adult group, when compared with 50 cN response, the level of IL-1β increased significantly in 100, 150 and 200 cN groups by 1.4-, 1.5-, and 1.4-fold, respectively (p < 0.05). However, the difference in the concentration of IL-1β was not statistically significant between 100 and 150 cN, between 100 and 200 cN, or between 150 and 200 cN groups (p > 0.05).
In the adolescent group, when compared with 50 cN response, IL-1β levels increased significantly in 100, 150 and 200 cN groups by 1.8-, 2.8-, and 2.7-fold, respectively (p < 0.05). When compared with 100 cN, IL-1β levels increased significantly in 150 and 200 cN groups by 1.55-, and 1.45-fold, respectively (p < 0.05). However, the difference IL-1β concentration was not statistically significant between 150 and 200 cN groups (p > 0.05).
In terms of comparison between the adult and adolescent groups, IL-1β levels were significantly higher in adults who received 50 and 100 cN force compared to the adolescents who received the same magnitude of force (p < 0.05).
In the adult group, the level of CCL2/MCP-1 (Monocyte Chemoattractant Protein-1) increased significantly in 100, 150 and 200 cN groups by 1.73-, 1.77, and 1.68-fold, respectively (p < 0.05) compared to the 50 cN group. However, the difference in CCL2/MCP-1 concentration was not significant between 100 and 150 cN groups, or 100 and 200cN group (p > 0.05).
In the adolescent group, CCLS levels increased significantly in 100, 150 and 200cN groups by 2.1, 3.6, and 4.0-fold, respectively (p < 0.05) compared to the 50 cN group. When compared with 100 cN, the level of CCL2 increased significantly in 150 and 200cN groups by 1.7, and 1.9-fold, respectively (p < 0.05). However, the difference in CCLS concentration was not significant between the 150 and 200cN group (p > 0.05). The level of CCL2 was significantly higher in adults who received 50 and 100cN force when compared with the adolescents who received the same magnitude of force. On the contrary, CCLS levels were significantly higher in adolescents who received 150 and 200cN force, when compared with the adults who received the same magnitude of force (p < 0.05)
The results demonstrated that in adults, there was an initial increase in the activity of inflammatory cytokines when forces increased from 50 to 100 cN, and then a plateau from 100 to 200cN force levels. Meanwhile, in adolescents, an initial increase in cytokine activities occurred when forces increased from 50 to 150 cN, and then plateaued from 150 to 200-cN force levels.
Figure 4. Activity of IL-1β and CCL2 demonstrate different saturation points of biological response in adolescents and adults. GCF was collected from distolabial gingival crevice of maxillary canines one day after activation of canine retraction. Mean concentrations of IL-1β (A) and CCL2 (B) in both age groups were evaluated by protein arrays. Each experiment was repeated 3 times, and the data was expressed as the mean ± standard deviation concentration in picograms per microliter (pg/μL) (#, significantly different from 50-cN group within the same age group; +, significantly different from 100-cN group within the same age group; *, significantly different between adolescents and adults who received the same force magnitude).
Activation of Osteoclasts
To evaluate the effect of magnitude of force on activation of osteoclasts between the two age groups, GCF samples were collected from the distobuccal gingival crevice of the canines one day after activation of canine retraction. The activity of osteoclast marker RANKL was measured by protein arrays, and the results are shown in Figure 5.
In the adult group, when compared with 50cN group, the level of RANKL increased significantly in 100, 150 and 200cN groups by 1.55, 1.52, and 1.3-fold, respectively (p < 0.05; Figure 6). However, the difference in RANKL concentration was not significant between 100- and 150-cN groups, nor between 100- and 200-cN groups (p > 0.05).
In the adolescent group, when compared with 50 cN, the level of RANKL increased significantly in 100, 150 and 200cN groups by 1.4, 2.1, and 2.3-fold, respectively (p < 0.05). When compared with 100 cN, the level of RANKL increased significantly in 150-and 200cN groups by 1.5, and 1.6-fold, respectively (p < 0.05). However, no significant differences were observed between adolescents who received 150 and 200cN force (p > 0.05). The level of RANKL was significantly higher in adults who received 100cN force, when compared with the adolescents who received the same magnitude of force. On the contrary, the level of RANKL was significantly higher in adolescents who received 200cN force when compared with the adults who received the same magnitude of force (p < 0.05).
The results demonstrate that in the adult group, there is an initial increase in the activity of osteoclast marker when forces increased from 50 to 100cN, and then a plateau from 100cN to 200-cN force levels. Meanwhile, in the adolescent group, an initial increase in cytokine activities occurred when forces increased from 50 to 150 cN, and then a plateau from 150 to 200cN force levels.
Figure 5. Osteoclast marker, RANKL, shows higher levels in adults in response to same magnitude of orthodontic force. GCF was collected from the distolabial gingival crevice of maxillary canines one day after retraction and mean concentration of RANKL was evaluated by a protein array. Each experiment was repeated 3 times, and the data was expressed as the mean ± standard deviation concentration in picograms per microliter (pg/μL) (#, significantly different from 50cN group within the same age group; +, significantly different from 100cN group within the same age group; *, significantly different between adolescents and adults who received the same force magnitude).
Amount of Tooth Movement
The amount of canine retraction in the first 28 days was measured on the study models at 3 landmarks: incisal, middle, and cervical thirds of the crowns (Fig 3B).
In the adolescent group, when compared with 50cN group, the amount of canine retraction increased significantly in 150 and 200cN groups by 1.56 and 1.60-fold, respectively (p < 0.05; Figure 6). However, the difference in the amount of canine retraction was not significant between subjects who received 100 and 150cN groups, or between 100 and 200cN groups (p > 0.05).
In the adult group, there was no significant difference in amount of canine retraction observed among all force groups (p > 0.05), although there was a clinically noticeable increase from 50 to 100 cN.
When compared the amount of movement in first 28 days between adolescents and adults who received the same magnitude of force, adolescents appeared to have a higher magnitude of movement in all force groups, however, the difference was not statistically significant (p > 0.05).
The results demonstrate that adolescents reached saturation of their biological response at a higher magnitude of force than adults, as the amount of tooth movement in adults did not increase with a higher magnitude of force as was seen in the adolescents.
Figure 6. Canine retraction in response to different magnitude of force in adolescents and adults. We measured the amount of tooth movement in millimeters measured at 3 landmarks (Fig. 3) for both adolescent and adult groups after 28 days of canine retraction. In the adolescent group, when compared with 50cN group, the average canine retraction increased significantly in the 150 and 200cN groups. Each value represents the mean ± standard deviation movement of all subjects in their respective age group (#, significantly different from 50cN group within the same age group, p < 0.05).
Tooth movement is the result of a biological reaction to force. In the absence of this biological response, there is no movement regardless of the magnitude of the force applied to the tooth. However, the relation between the magnitude of force and the magnitude of biological response is not linear. Our previous studies have shown saturation of the biological response to higher magnitudes of force in animals [1]. Our current study has demonstrated that this phenomenon is also observed in humans. This is clinically important, since it supports the conclusion that applying higher orthodontic forces in human does not linearly increase the rate of tooth movement. This can also explain why there are conflicting reports in the literature on the effect of the magnitude of the orthodontic force and the rate of tooth movement. While some studies have shown that application of higher forces does not increase the rate of tooth movement [7, 14], others have argued the opposite [9]. Results vary based on the magnitude of force used and the saturation point in the individual. If the force that is used surpasses the saturation point of the biological response, the study will not show any increase in rate of tooth movement with an increase in force magnitude. On the other hand, if the force used is below the saturation point in that individual, increasing the force could still show increase in the rate of tooth movement.
Another important finding in this study and our previous study [10] is that both the biological response and saturation point can vary significantly between individuals. Our findings were in agreement with those of animal studies that have shown that even with standardized, constant, and equal forces, the rate of orthodontic tooth movement can vary substantially between and even within subjects [15, 16]. This is very important when selecting the optimal force for our patients.
The concept of “an optimal orthodontic force” has been the subject of investigation for decades. This concept has evolved over the last 80 years. Earlier studies (before 1980) focused on efficiency of OTM by using light vs. heavy force, and later studies focused on histological and cell biological changes, or side effects such as root resorption. The first definition was proposed in 1932 [17], “the force leading to a change in tissue pressure that approximated the capillary vessels’ blood pressure, thus preventing their occlusion in the compressed periodontal ligament.” According to this definition, forces well below the optimal level cause no reaction in the PDL. Forces exceeding the optimal level would lead to areas of tissue necrosis. Other definitions have been proposed, “the lightest force capable of bringing about tooth movement”. This concept of optimal force is based on the hypothesis that a force of a certain magnitude and temporal characteristics would be capable of producing a maximum rate of tooth movement without tissue damage and with maximum patient comfort. However, Reitan observed cell-free zones within PDL even in cases where light forces were applied [18]. It was also observed that the optimal force for tooth movement may differ for each tooth and for each individual patient [19-21]. Due to the lack of specific standard to define the optimal force, the appropriate forces for movement of human teeth reportedly range from a force as light as 18 g to one as heavy as 1,515 g [20, 22-24].
Although defining optimal force is not the main concern of our study, it’s worth mentioning that the concept of optimal force can be re-invented from a biological response point of view. From this perspective, an optimal force is defined based on the saturation point of that particular patient and situation, as a force that induces maximum biological response close to reaching its saturation, after which an increase in the force cannot further increase the inflammatory response. The difference in saturation point between adults and adolescents implies that lower magnitudes of orthodontic force should be utilized in treating adult patients to optimize the amount of tooth movement and avoid adverse tissue responses.
One question remains, what parameter best measures the biological response. Teixeira et al. [25] demonstrated that since the initial phenomenon of tooth movement is release of inflammatory markers, one can measure the release of inflammatory markers in response to different magnitude of the force as representing the biological response. But why should we not use the rate of tooth movement as the yard stick to measure the biological response? Although tooth movement is the desired result of the biological response to orthodontic forces, it may not necessarily be a precise representative of the biological response that causes tooth movement, since many other factors can affect the amount of tooth movement [20, 26, 27]. In other words, two patients can have similar biological response to identical forces but demonstrate different rates of tooth movement, not due to the magnitude of the force, but due to anatomical variations such as bone density. These variations can obscure the relation between magnitude of the force and magnitude of biological response if we use tooth movement as the only reference. Unfortunately, the majority of the studies evaluating the difference in the rate of tooth movement to different magnitudes of force in animals [9, 15, 16, 20, 28-30] and humans [7, 20, 22, 24, 31] focus on the rate of movement as the main measurement and little evidence is available regarding the differences in terms of biological reactions to different magnitudes of orthodontic force, especially in humans [24, 32].
The inflammatory markers we selected for analysis in this study were based on their known functions and the results from our previous studies [13, 25]. The most practical place to collect these biomarkers is the GCF. The presence/expression of regulatory proteins in the GCF has been recognized as a promising non-invasive diagnostic tool for monitoring orthodontic treatment outcomes [33] since it has been shown that GCF may reflect the immune and inflammatory reactions arising from the application of orthodontic force [8, 34-36].
Our present study demonstrates that the concentrations of cytokines (such as IL-1β) and chemokines (such as CCL-2) were significantly elevated during orthodontic tooth movement, they responded immediately after orthodontic loading and they can be used as reliable biomarkers to measure the biological response to orthodontic forces.
At a lower level of force, there was an initial increase in the levels of inflammatory cytokines in both age groups, and then it reached saturation with increased force magnitude. While in adults, the saturation occurred between 100 to 150cN of force, in adolescents, the same saturation occurred between 150 to 200cN of force. Such a difference implies that younger individuals have higher saturation points than mature individuals. We believe this is the first study in orthodontics describing and comparing such phenomena and differences.
The observation of different saturation points between individuals also resonates and further explains the rationale for choosing an appropriate force magnitude in our previous clinical study [13]. We selected a force magnitude of 50 cN for canine retraction in that study to avoid the effect of saturation we observed in our animal study and the present clinical study. In the present study, we observed that adults reached their saturation point at a lower force magnitude than adolescents; in other words, while the biological response to a 50cN force was higher in adults than in adolescents who received the identical force, the biological response to a 150 or 200cN force was higher in adolescents than in adults. As a result, if in the last clinical study we had chosen a much higher magnitude of force that had surpassed the saturation point of either or both age groups, we would have observed false positive or false negative results and drawn a misleading conclusion, as was reported in other studies that used much higher magnitudes of force to evaluate the biological responses among individuals [37].
Since inflammatory molecules play significant roles in the recruitment and activation of osteoclast precursor cells, one may assume that increased activities of these factors would be accompanied by higher osteoclast activation and therefore a higher rate of tooth movement [38-41]. However, this is only partially true as individual differences should be evaluated as two entities. While a higher level of these inflammatory markers results in a greater rate of OTM within the same individual, a higher level of inflammatory markers does not guarantee a greater rate of OTM when comparing different individuals, as we observed in this study. Similarly, the saturation point cannot be predicted based on that of another individual. On the other hand, in the same individual, if there is no significant difference in biological response to two different magnitudes of force, we do not expect a substantial difference in the rate of OTM either.
Osteoclasts, which resorb bone and allow tooth movement, require time to carry out their catabolic functions. Therefore, the observation period of each study is significant. Short duration experiments may not provide enough time to observe the difference in rate of tooth movement since bone resorption has not progressed enough, and overly long duration experiments may be influenced by many variables that can change the outcome of the study. The observation period of the rate of movement in this study was limited to 28 days after retraction, as during the process of bone remodeling, bone mineral density and microenvironments surrounding the tooth constantly change over the course of tooth movement in the long term. Therefore, as bone remodeling progresses, the biological response within the same individual is unlikely to remain the same over time. Likewise, the saturation point could change over time within the same individual. The difference in biological responses and rate of tooth movement in response to the changing microenvironment over time require further research, and is currently being investigated by our research group. On the other hand, the downside of such short-term observation is that the difference between age groups on the rate of tooth movement was not obvious enough to reach statistical significance. While the duration of 28 days did not provide enough time to demonstrate difference in rate of tooth movement between different age groups in our current study, the result still demonstrated a trend of faster movement in adolescents than adults, in general.
Many factors other than age could affect the rate of tooth movement and warrant further research. Poor oral hygiene, periodontal disease, advanced alveolar bone loss, systemic diseases, and anti-inflammatory medications can affect the rate of tooth movement significantly [42-44]. To minimize the influence from these factors, we set clear exclusion criteria, as summarized in Table 1, and the subjects were able to follow the instructions.
Based on above discussion, while increasing the orthodontics force magnitude does not overcome this limitation, other methodologies, such as micro-osteoperforations (MOPs) are sometimes necessary to enhance the biological response, in turn improving treatment efficiency and decreasing adverse tissue response in certain clinical scenarios [13, 45]. It is reasonable to conclude that since the saturation point is lower in adults, acceleration techniques are justified on adults rather than juveniles.
In summary, the result of our study suggested using the level of the inflammatory response as a predictive factor for the rate of tooth movement and optimal force. In our clinical study we found a difference in the saturation of biological response and thus, the optimal force for OTM among different individuals. Therefore, predicting an individual’s saturation point based on another individual information would be erroneous without considering individual variables such as age. One should always compare the level of inflammatory markers and saturation point within the same individual.
Our findings have significant values for the development of diagnostic tools. While the results of our animal study suggest using the level of the inflammatory response as a predictive factor for the rate of tooth movement, the results from our clinical study indicated that this would be erroneous without considering individual variables such as age. Therefore, one should always compare the level of inflammatory markers within the same individual and not extrapolate a result from one person to another. Based on this observation, any diagnostic tools created could use the changes in inflammatory markers in CGF to monitor the biological response to different forces and compare the results in the same individual at various time points to select the optimal force range for that individual.
1. Alikhani M, Alyami B, Lee IS, Almoammar S, Vongthongleur T, Alikhani M, et al. Saturation of the biological response to orthodontic forces and its effect on the rate of tooth movement. Orthod Craniofac Res. 2015;18 Suppl 1:8-17. doi: 10.1111/ocr.12090. PubMed PMID: 25865529.
2. Fox N. Longer orthodontic treatment may result in greater external apical root resorption. Evid Based Dent. 2005;6(1):21. doi: 10.1038/sj.ebd.6400304. PubMed PMID: 15789049.
3. Roscoe MG, Meira JB, Cattaneo PM. Association of orthodontic force system and root resorption: A systematic review. Am J Orthod Dentofacial Orthop. 2015;147(5):610-26. doi: 10.1016/j.ajodo.2014.12.026. PubMed PMID: 25919107.
4. Sameshima GT, Sinclair PM. Predicting and preventing root resorption: Part II. Treatment factors. Am J Orthod Dentofacial Orthop. 2001;119(5):511-5. doi: 10.1067/mod.2001.113410. PubMed PMID: 11343023.
5. Weltman B, Vig KW, Fields HW, Shanker S, Kaizar EE. Root resorption associated with orthodontic tooth movement: a systematic review. Am J Orthod Dentofacial Orthop. 2010;137(4):462-76; discussion 12A. doi: 10.1016/j.ajodo.2009.06.021. PubMed PMID: 20362905.
6. Segal GR, Schiffman PH, Tuncay OC. Meta analysis of the treatment-related factors of external apical root resorption. Orthod Craniofac Res. 2004;7(2):71-8. doi: 10.1111/j.1601-6343.2004.00286.x. PubMed PMID: 15180086.
7. Quinn RS, Yoshikawa DK. A reassessment of force magnitude in orthodontics. Am J Orthod. 1985;88(3):252-60. doi: 10.1016/s0002-9416(85)90220-9. PubMed PMID: 3862348.
8. Ren Y, Maltha JC, Van’t Hof MA, Von Den Hoff JW, Kuijpers-Jagtman AM, Zhang D. Cytokine levels in crevicular fluid are less responsive to orthodontic force in adults than in juveniles. J Clin Periodontol. 2002;29(8):757-62. doi: 10.1034/j.1600-051x.2002.290813.x. PubMed PMID: 12390573.
9. Yee JA, Türk T, Elekdağ-Türk S, Cheng LL, Darendeliler MA. Rate of tooth movement under heavy and light continuous orthodontic forces. Am J Orthod Dentofacial Orthop. 2009;136(2):150.e1-9; discussion -1. doi: 10.1016/j.ajodo.2009.03.026. PubMed PMID: 19651334.
10. Alikhani M, Chou MY, Khoo E, Alansari S, Kwal R, Elfersi T, et al. Age-dependent biologic response to orthodontic forces. Am J Orthod Dentofacial Orthop. 2018;153(5):632-44. doi: 10.1016/j.ajodo.2017.09.016. PubMed PMID: 29706211.
11. Dahlberg G. Statistical methods for medical and biological students: G. Allen & Unwin ltd.; 1940.
12. Houston WJ. The analysis of errors in orthodontic measurements. American journal of orthodontics. 1983;83(5):382-90. Epub 1983/05/01. PubMed PMID: 6573846.
13. Alikhani M, Raptis M, Zoldan B, Sangsuwon C, Lee YB, Alyami B, et al. Effect of micro-osteoperforations on the rate of tooth movement. Am J Orthod Dentofacial Orthop. 2013;144(5):639-48. doi: 10.1016/j.ajodo.2013.06.017. PubMed PMID: 24182579.
14. Ren Y, Maltha JC, Van ‘t Hof MA, Kuijpers-Jagtman AM. Optimum force magnitude for orthodontic tooth movement: a mathematic model. Am J Orthod Dentofacial Orthop. 2004;125(1):71-7. doi: 10.1016/j.ajodo.2003.02.005. PubMed PMID: 14718882.
15. Pilon JJ, Kuijpers-Jagtman AM, Maltha JC. Magnitude of orthodontic forces and rate of bodily tooth movement. An experimental study. Am J Orthod Dentofacial Orthop. 1996;110(1):16-23. doi: 10.1016/s0889-5406(96)70082-3. PubMed PMID: 8686673.
16. van Leeuwen EJ, Maltha JC, Kuijpers-Jagtman AM. Tooth movement with light continuous and discontinuous forces in beagle dogs. European journal of oral sciences. 1999;107(6):468-74. Epub 2000/01/07. PubMed PMID: 10625106.
17. Schwarz AM. Tissue changes incidental to orthodontic tooth movement. International Journal of Orthodontia, Oral Surgery and Radiography. 1932;18(4):331-52. doi: https://doi.org/10.1016/S0099-6963(32)80074-8.
18. Reitan K. Clinical and histologic observations on tooth movement during and after orthodontic treatment. Am J Orthod. 1967;53(10):721-45. doi: 10.1016/0002-9416(67)90118-2. PubMed PMID: 5233926.
19. Proffit WR. The Biologic Basis of Orthodontic Therapy. In: Proffit WR, Fields HW, Sarver DM, editors. Contemporary Orthodontics: Elsevier/Mosby; 2013. p. 278-311.
20. Ren Y, Maltha JC, Kuijpers-Jagtman AM. Optimum force magnitude for orthodontic tooth movement: a systematic literature review. Angle Orthod. 2003;73(1):86-92. doi: 10.1043/0003-3219(2003)073<0086:Ofmfot>2.0.Co;2. PubMed PMID: 12607860.
21. Krishnan V, Davidovitch Z. Cellular, molecular, and tissue-level reactions to orthodontic force. Am J Orthod Dentofacial Orthop. 2006;129(4):469.e1-32. doi: 10.1016/j.ajodo.2005.10.007. PubMed PMID: 16627171.
22. Iwasaki LR, Haack JE, Nickel JC, Morton J. Human tooth movement in response to continuous stress of low magnitude. Am J Orthod Dentofacial Orthop. 2000;117(2):175-83. doi: 10.1016/s0889-5406(00)70229-0. PubMed PMID: 10672218.
23. Hixon EH, Aasen TO, Clark RA, Klosterman R, Miller SS, Odom WM. On force and tooth movement. American journal of orthodontics. 1970;57(5):476-8. Epub 1970/05/01. PubMed PMID: 5265830.
24. Luppanapornlarp S, Kajii TS, Surarit R, Iida J. Interleukin-1beta levels, pain intensity, and tooth movement using two different magnitudes of continuous orthodontic force. Eur J Orthod. 2010;32(5):596-601. Epub 20100609. doi: 10.1093/ejo/cjp158. PubMed PMID: 20534713.
25. Teixeira CC, Khoo E, Tran J, Chartres I, Liu Y, Thant LM, et al. Cytokine expression and accelerated tooth movement. J Dent Res. 2010;89(10):1135-41. Epub 20100716. doi: 10.1177/0022034510373764. PubMed PMID: 20639508; PubMed Central PMCID: PMCPMC3318047.
26. Krishnan V, Davidovitch Z. Effects of systemic diseases on orthodontic tooth movement. In: Krishnan V, Davidovitch Z, editors. Biological Mechanisms of Tooth Movement. Oxford, UK: Wiley; 2009. p. 143-66.
27. Dudic A, Giannopoulou C, Kiliaridis S. Factors related to the rate of orthodontically induced tooth movement. Am J Orthod Dentofacial Orthop. 2013;143(5):616-21. doi: 10.1016/j.ajodo.2012.12.009. PubMed PMID: 23631963.
28. Storey E, Smith R. Force in orthodontics and its relation to tooth movement. Aust J Dent. 1952;56(1):11-8.
29. Gonzales C, Hotokezaka H, Yoshimatsu M, Yozgatian JH, Darendeliler MA, Yoshida N. Force Magnitude and Duration Effects on Amount of Tooth Movement and Root Resorption in the Rat Molar. The Angle orthodontist. 2008;78(3):502-9. doi: doi:10.2319/052007-240.1. PubMed PMID: 18416627.
30. Van Leeuwen EJ, Kuijpers-Jagtman AM, Von den Hoff JW, Wagener FA, Maltha JC. Rate of orthodontic tooth movement after changing the force magnitude: an experimental study in beagle dogs. Orthod Craniofac Res. 2010;13(4):238-45. doi: 10.1111/j.1601-6343.2010.01500.x. PubMed PMID: 21040467.
31. Boester CH, Johnston LE. A clinical investigation of the concepts of differential and optimal force in canine retraction. Angle Orthod. 1974;44(2):113-9. doi: 10.1043/0003-3219(1974)044<0113:Aciotc>2.0.Co;2. PubMed PMID: 4597626.
32. Iwasaki LR, Haack JE, Nickel JC, Reinhardt RA, Petro TM. Human interleukin-1 beta and interleukin-1 receptor antagonist secretion and velocity of tooth movement. Arch Oral Biol. 2001;46(2):185-9. doi: 10.1016/s0003-9969(00)00088-1. PubMed PMID: 11163326.
33. Ren Y, Vissink A. Cytokines in crevicular fluid and orthodontic tooth movement. Eur J Oral Sci. 2008;116(2):89-97. doi: 10.1111/j.1600-0722.2007.00511.x. PubMed PMID: 18353001.
34. Ren Y, Hazemeijer H, de Haan B, Qu N, de Vos P. Cytokine profiles in crevicular fluid during orthodontic tooth movement of short and long durations. J Periodontol. 2007;78(3):453-8. doi: 10.1902/jop.2007.060261. PubMed PMID: 17335368.
35. Kapoor P, Kharbanda OP, Monga N, Miglani R, Kapila S. Effect of orthodontic forces on cytokine and receptor levels in gingival crevicular fluid: a systematic review. Progress in orthodontics. 2014;15:65. Epub 2014/12/10. doi: 10.1186/s40510-014-0065-6. PubMed PMID: 25487828; PubMed Central PMCID: PMCPmc4259981.
36. Uematsu S, Mogi M, Deguchi T. Interleukin (IL)-1 beta, IL-6, tumor necrosis factor-alpha, epidermal growth factor, and beta 2-microglobulin levels are elevated in gingival crevicular fluid during human orthodontic tooth movement. J Dent Res. 1996;75(1):562-7. doi: 10.1177/00220345960750010801. PubMed PMID: 8655760.
37. Kawasaki K, Takahashi T, Yamaguchi M, Kasai K. Effects of aging on RANKL and OPG levels in gingival crevicular fluid during orthodontic tooth movement. Orthod Craniofac Res. 2006;9(3):137-42. Epub 2006/08/22. doi: 10.1111/j.1601-6343.2006.00368.x. PubMed PMID: 16918678.
38. Fuller K, Kirstein B, Chambers TJ. Murine osteoclast formation and function: differential regulation by humoral agents. Endocrinology. 2006;147(4):1979-85. Epub 20051229. doi: 10.1210/en.2005-1340. PubMed PMID: 16384864.
39. Suzawa T, Miyaura C, Inada M, Maruyama T, Sugimoto Y, Ushikubi F, et al. The role of prostaglandin E receptor subtypes (EP1, EP2, EP3, and EP4) in bone resorption: an analysis using specific agonists for the respective EPs. Endocrinology. 2000;141(4):1554-9. doi: 10.1210/endo.141.4.7405. PubMed PMID: 10746663.
40. Jimi E, Ikebe T, Takahashi N, Hirata M, Suda T, Koga T. Interleukin-1 alpha activates an NF-kappaB-like factor in osteoclast-like cells. J Biol Chem. 1996;271(9):4605-8. doi: 10.1074/jbc.271.9.4605. PubMed PMID: 8617720.
41. O’Brien CA, Gubrij I, Lin SC, Saylors RL, Manolagas SC. STAT3 activation in stromal/osteoblastic cells is required for induction of the receptor activator of NF-kappaB ligand and stimulation of osteoclastogenesis by gp130-utilizing cytokines or interleukin-1 but not 1,25-dihydroxyvitamin D3 or parathyroid hormone. J Biol Chem. 1999;274(27):19301-8. doi: 10.1074/jbc.274.27.19301. PubMed PMID: 10383440.
42. Knop LA, Shintcovsk RL, Retamoso LB, Ribeiro JS, Tanaka OM. Non-steroidal and steroidal anti-inflammatory use in the context of orthodontic movement. Eur J Orthod. 2012;34(5):531-5. Epub 20110208. doi: 10.1093/ejo/cjq173. PubMed PMID: 21303808.
43. Okamoto A, Ohnishi T, Bandow K, Kakimoto K, Chiba N, Maeda A, et al. Reduction of orthodontic tooth movement by experimentally induced periodontal inflammation in mice. Eur J Oral Sci. 2009;117(3):238-47. doi: 10.1111/j.1600-0722.2009.00625.x. PubMed PMID: 19583750.
44. Bartzela T, Türp JC, Motschall E, Maltha JC. Medication effects on the rate of orthodontic tooth movement: a systematic literature review. Am J Orthod Dentofacial Orthop. 2009;135(1):16-26. doi: 10.1016/j.ajodo.2008.08.016. PubMed PMID: 19121496.
45. Alikhani M, Alansari S, Sangsuwon C, Alikhani M, Chou MY, Alyami B, et al. Micro-osteoperforations: Minimally invasive accelerated tooth movement. Seminars in Orthodontics. 2015;21(3):162-9. doi: https://doi.org/10.1053/j.sodo.2015.06.002.


